
About Me
With a PhD in Political Science and an MA in Criminal Justice Studies, I bring two decades of experience in data analysis and research, particularly in the social and security sectors. My expertise goes beyond technical skills—I create interactive dashboards, insightful reports, and impactful data visualizations that help organizations make smarter, data-driven decisions.
I specialize in transforming complex raw data into clear, actionable insights. My data solutions empower businesses, NGOs, government institutions, and international organizations to improve operational efficiency, optimize resources, and enhance strategic decision-making.
Whether it's helping local governments manage public services more effectively, supporting environmental and law enforcement agencies with risk assessments, or enabling NGOs to track field operations with real-time insights, I ensure data is not just analyzed but put into action.
Data is not just numbers—it’s a powerful tool for transformation. Let’s discuss how my tailored data solutions can help your organization unlock its full potential.
What I Offer
Data Analysis & Reporting
Uncover insights from complex datasets using statistical and exploratory techniques.
Examples:
• Cluster and indicator analysis of youth crime risk factors (Eindhoven)
• Comparative analysis of crime indicators across major Dutch cities
• Spatial comparison of nuisance incidents and alcohol-ban zones (Eindhoven)
• Factor analysis of strategic threat profiles in terrorism research
• Spatial network analysis of soil flows between company locations (Friesland)
Custom BI Solutions
Design and build interactive dashboards tailored to KPIs and decision-making needs.
Examples:
• Youth crime dashboard (Power BI – project PmG, Eindhoven)
• Field activity monitoring dashboard (Power BI – public nuisance response team, Eindhoven)
• Social nuisance incidents dashboard with hotspot & seasonal analysis (Power BI – Eindhoven)
• Inventory optimization dashboard with dynamic reorder logic (Power BI)
• Exploration dashboard for publishing datasets (Tableau – Elsevier)
Geospatial Analytics
Combine spatial and operational data for meaningful regional insights.
Examples:
• Hotspot maps of public nuisance complaints (Eindhoven) – geocoded reports using Python and postcode data to visualize spatial distribution of incidents.
• Humanitarian security maps with layered icon overlays – QGIS and Power BI integration for incident trends and regional risks.
• Global governance choropleth maps – part of the Rule of Law Index dashboard with dynamic region filtering and multi-year trends (Power BI).
Recent Work
Below is a selection of recent data projects in governance, public safety, and humanitarian sectors. Full documentation is available for select projects; others are summarized due to organizational confidentiality.
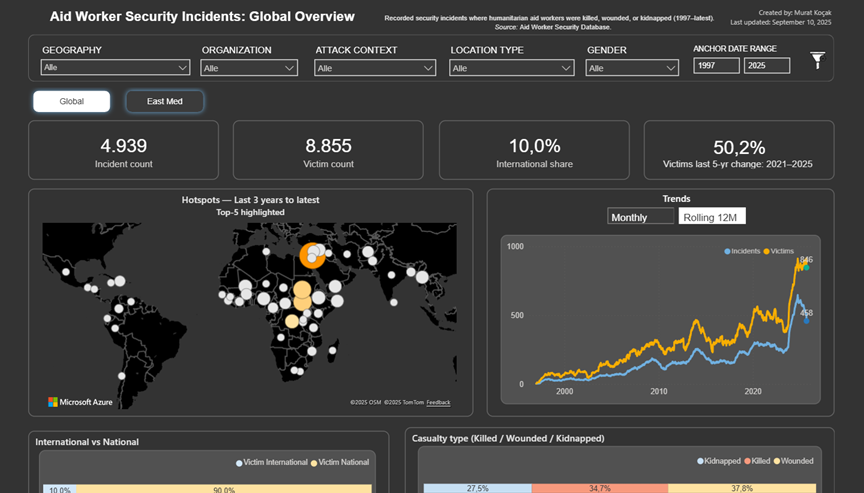
Humanitarian Security Dashboard
A Power BI and QGIS project that visualizes over two decades of security incidents involving humanitarian aid workers, using data from the Aid Worker Security Database (AWSD). It reveals global patterns in attack types, victim profiles, and geographic hotspots, including custom visuals for the East Mediterranean corridor. Designed for NGOs and security teams to support risk assessment, resource allocation, and operational planning in high-risk areas.
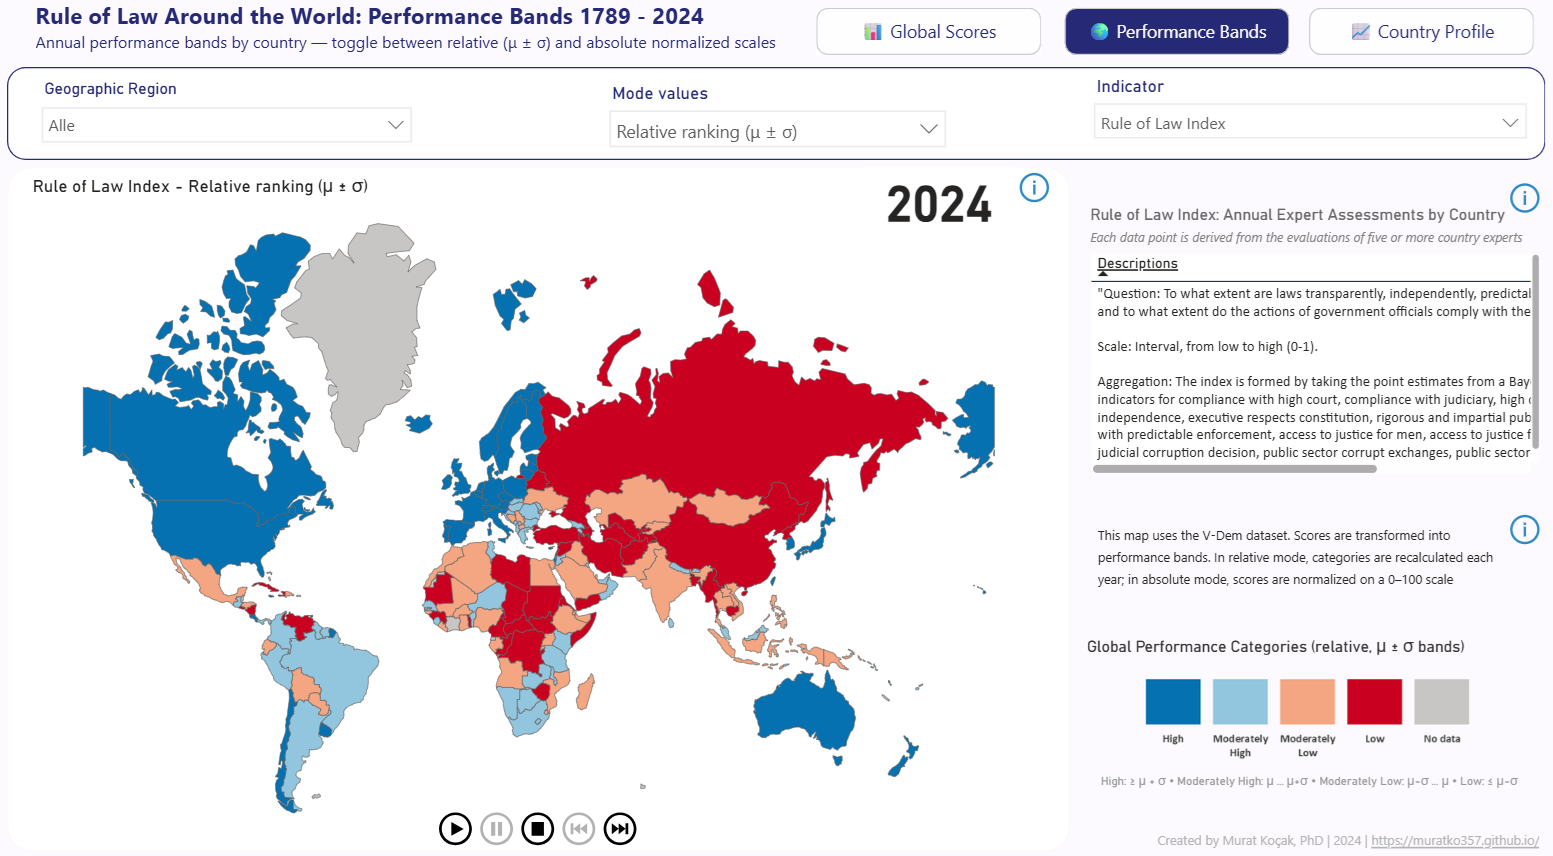
Rule of Law Index Dashboard
A dynamic Power BI dashboard that tracks the Rule of Law Index and related governance indicators across 170+ countries from 1789 to 2024, based on the V‑Dem dataset. Users can explore historical trends, global rankings, and country-level developments through interactive maps and filters. Built for researchers, policymakers, and analysts working on institutional resilience, governance, and international security risks.
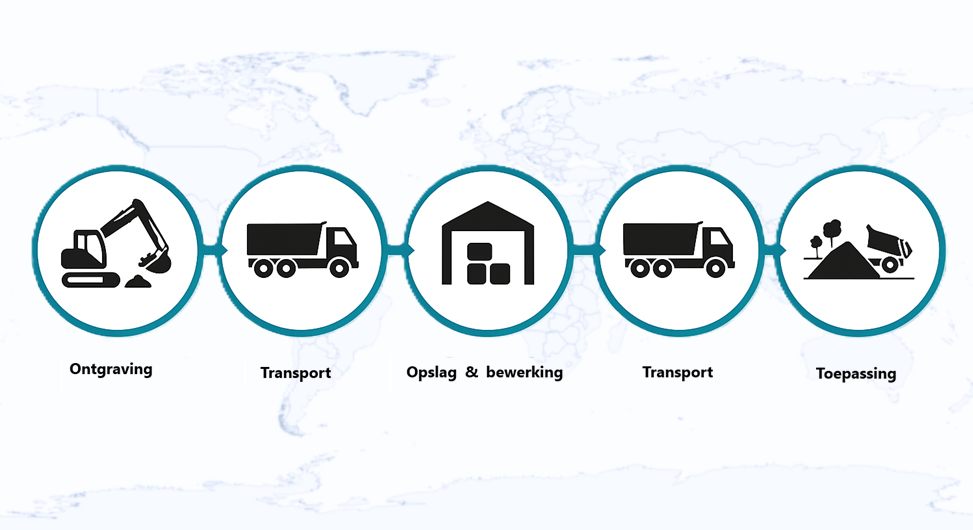
Barrier Model for Soil Chain Supervision
A research-driven model currently in development for FUMO, the regional environmental agency in Friesland. It maps risks, actors, signals, and process steps in the soil chain based on expert input and extensive desk research. The project supports data-informed environmental supervision through typologies, risk matrices, and system-level insights. The research phase is nearing completion, with future extensions planned for monitoring and practical implementation.